The Money Against You
Between 2018 and 2024, $2.38 billion was spent trying to defeat sitting members of Congress. $1.12 billion was spent supporting them. Attack money is the largest bucket in American congressional politics — bigger than every direct campaign contribution combined. And it is almost perfectly bipartisan: the two parties absorbed amounts 0.4 percent apart.
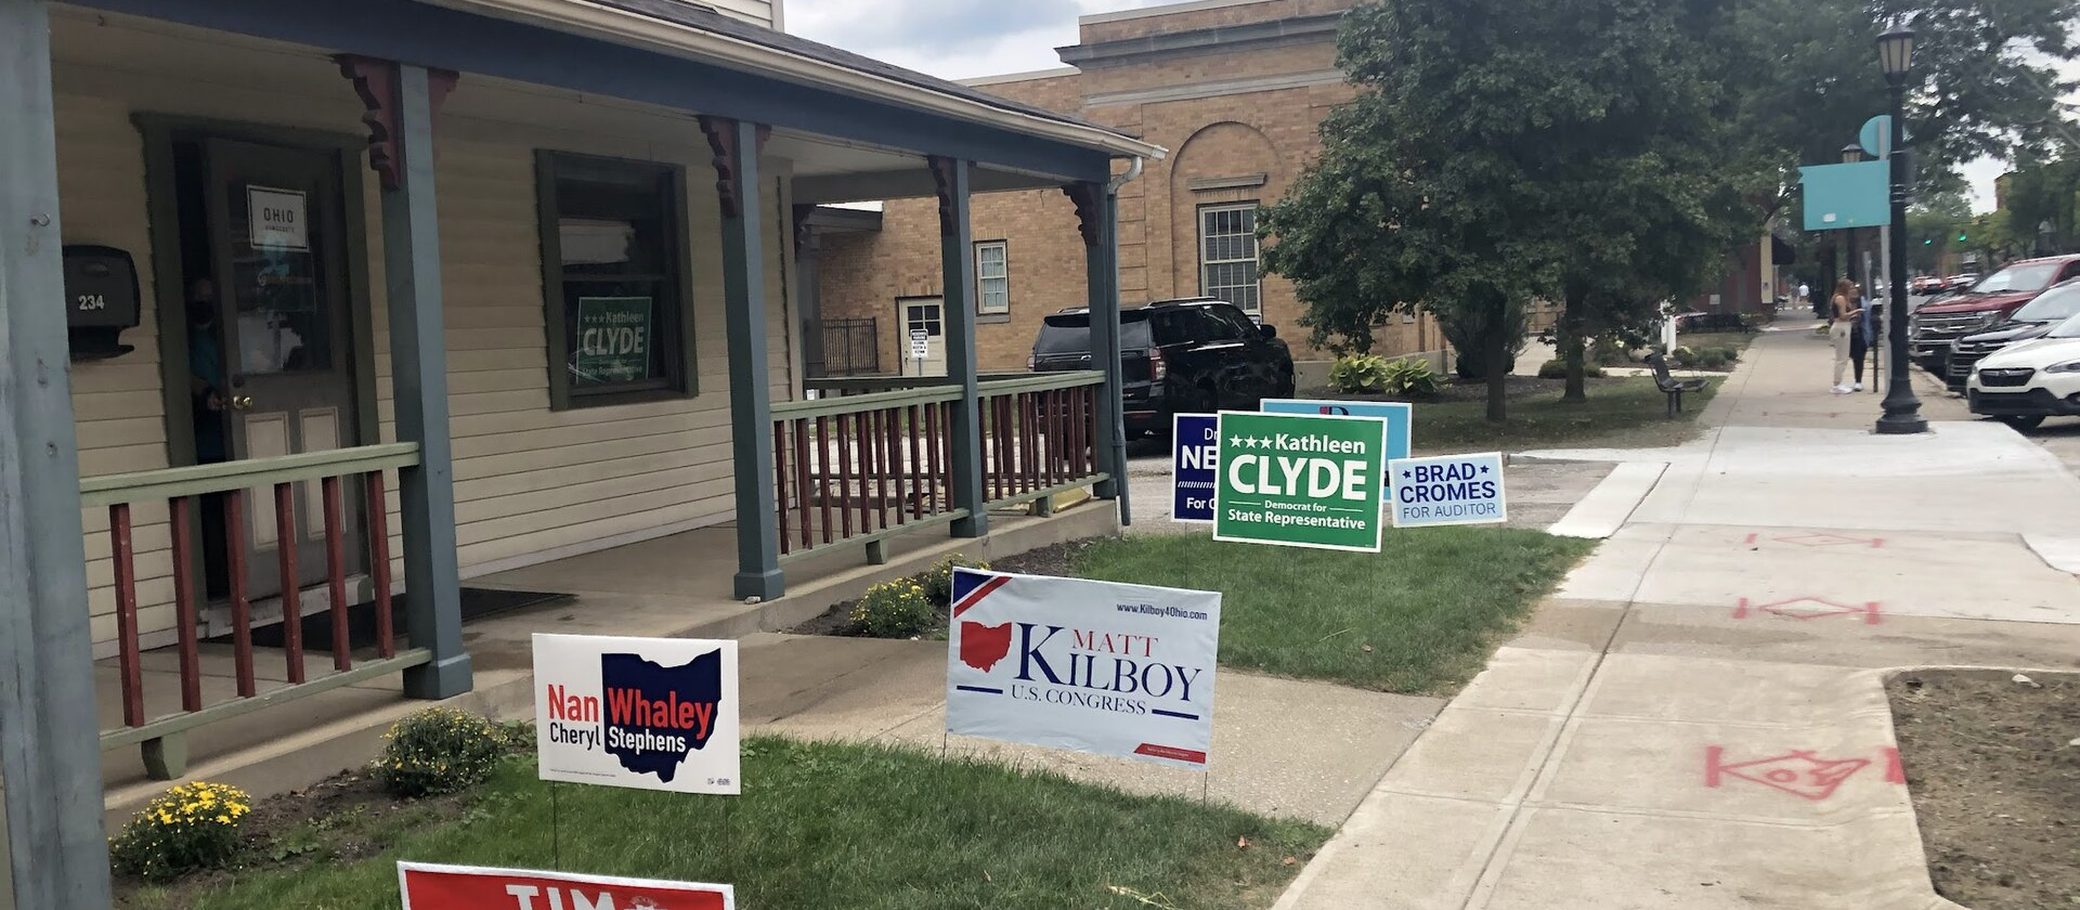
Campaign money is usually counted as one figure: how much was spent around a candidate. Federal Election Commission records do not work that way. Every independent expenditure carries a direction code — spent for a candidate, or against one — and the difference is the whole story. GovGreed summed the directional PAC and independent-expenditure record around 520 sitting members of Congress across four completed cycles, 2018–2024. Money spent to defeat them: $2,383.4M. Money spent to support them: $1,119.2M. Direct PAC contributions to their campaigns — the thing most people mean by “campaign contributions” — $1,303.9M. Attack spending is the single largest bucket in the system, 2.13× the supportive independent spending, and just under half of all money in it. It is also almost perfectly symmetrical: $1,195.8M attacking Democrats, $1,185.1M attacking Republicans — a gap of 0.4 percent, at ratios of 2.11× and 2.14×. The twelve most-attacked members are six Democrats and six Republicans. Joni Ernst (R-IA) drew $82.1M in opposition against $10.6M in support: 7.8× more money wanted her gone than wanted her there. A tracker that sums expenditures without reading the direction code reports the money spent to destroy a member as money supporting them.
- Key findings
- $2,383.4M was spent in opposition to sitting members across 2018–2024, versus $1,119.2M in support — a ratio of 2.13 to 1.
- Attack spending is larger than every direct PAC contribution combined ($1,303.9M). It is the biggest single bucket in congressional campaign finance.
- It is bipartisan to within 0.4 percent: $1,195.8M attacking Democrats, $1,185.1M attacking Republicans. Ratios of 2.11× and 2.14×.
- Joni Ernst (R-IA) is the ratio outlier at 7.8× ($82.1M against, $10.6M for). Susan Collins (R-ME) 6.1×; Jon Ossoff (D-GA) 4.7×; Tammy Baldwin (D-WI) 4.7×.
- The 2020 cycle was the extreme: 62.2% of all money that cycle was spent attacking someone.
1. $82 million to remove one senator
Between 2018 and 2024, outside groups spent $82.1 million on advertising and other independent expenditures aimed at defeating Joni Ernst, the Republican senator from Iowa. Over the same period they spent $10.6 million supporting her. Her own campaign took $5.1 million in direct PAC contributions.
Put the three numbers next to each other and the ordinary picture of campaign finance inverts. The money that flows to a member of Congress — the checks, the fundraisers, the thing that gets called a contribution — is the smallest of the three. The largest, by a factor of sixteen, is money spent by strangers trying to end her career.
Ernst is the extreme, not the exception. Run the same split across every sitting member and the shape holds.
2. Data and methodology
Federal Election Commission bulk records log every PAC and party-committee disbursement as a separate transaction, keyed to the candidate it concerns. Crucially, each independent expenditure carries a direction code: the filer must state whether the money was spent in support of a candidate or in opposition to one. We keyed those transactions to each member's FEC candidate identifier and split them three ways:
- The three buckets
- Direct PAC contributions — money given to the member's own principal campaign committee. The member controls it.
- Independent expenditures, in support — money spent advocating for the member by groups legally barred from coordinating with them.
- Independent expenditures, in opposition — money spent advocating against the member. The member neither controls nor reports it, and often learns about it the same way voters do.
Amounts are real per-transaction filings, not estimates and not bracket midpoints. This paper covers the four completed cycles — 2018, 2020, 2022, 2024 — across 520 members with a matched FEC candidate record.
The 2026 cycle is deliberately excluded. It is still running: the record currently shows $247.9M already contributed directly but only $5.4M in opposition spending, because the advertising has not been bought yet. Including a live cycle would understate attack spending badly and flatter the conclusion. It is left out and reported here instead.
One negative note, stated because it is the reason this analysis is not routine. GovGreed maintains a separate contributions table whose per-member attribution is known to be unreliable, and it is not used anywhere in this paper. Every figure here comes from the per-transaction PAC record, read with the FEC's own direction codes.
3. The receipts: attacking is the biggest business in politics
Table 1 is every completed cycle. The rightmost column is the share of all money that cycle spent trying to defeat somebody.
Table 1 · Congressional campaign money by direction, completed cycles| Cycle | Members | Direct PAC | Spent FOR | Spent AGAINST | Total | % against |
|---|---|---|---|---|---|---|
| 2018 | 321 | $227.2M | $96.0M | $232.8M | $556.0M | 41.9% |
| 2020 | 371 | $296.5M | $214.8M | $840.1M | $1,351.4M | 62.2% |
| 2022 | 448 | $345.8M | $383.7M | $572.6M | $1,302.0M | 44.0% |
| 2024 | 519 | $434.3M | $424.7M | $738.0M | $1,597.0M | 46.2% |
| Total | 520 | $1,303.9M | $1,119.2M | $2,383.4M | $4,806.5M | 49.6% |
Members column counts distinct members with money recorded that cycle; the total row counts distinct members across all four (520), not the sum of the column. The 2026 cycle is excluded as incomplete. Amounts are per-transaction FEC filings. Verified July 15, 2026.
The 2020 cycle is worth pausing on: 62.2 percent of all money that year was opposition spending, and $840.1M of attack advertising is more than the entire 2018 cycle put together, in every direction.
4. The pattern: the machine is symmetrical
The obvious next question is who is doing this to whom. The answer is that both sides are doing it to each other, at almost exactly the same rate.
Table 2 · Attack money by party, 2018–2024| Party | Members | Direct PAC | Spent FOR | Spent AGAINST | Against per $1 for |
|---|---|---|---|---|---|
| Democrats | 254 | $626.7M | $566.1M | $1,195.8M | $2.11 |
| Republicans | 264 | $674.0M | $553.1M | $1,185.1M | $2.14 |
Two independents are omitted from this table (2 members, $2.5M in opposition) because the sample is too small to characterise. Verified July 15, 2026.
$1,195.8 million versus $1,185.1 million. A difference of roughly $11 million on $2.4 billion — four tenths of one percent. The ratios land at 2.11 and 2.14. Whatever else divides the two parties, the amount of money spent trying to destroy their members is, to three significant figures, the same.
Independent expenditures only, for versus against, as a share of each party's independent-expenditure total. Direct PAC contributions excluded from the bars.
The most-attacked list says the same thing without any arithmetic. Six Democrats, six Republicans, in the order the data produced them.
Table 3 · The twelve most-attacked members, 2018–2024| Member | Party / State | Spent AGAINST | Spent FOR | Ratio | Cycles |
|---|---|---|---|---|---|
| Raphael Warnock | D–GA | $148.2M | $81.0M | 1.8× | 3 |
| Jon Ossoff | D–GA | $138.4M | $29.4M | 4.7× | 3 |
| Bernie Moreno | R–OH | $85.7M | $72.2M | 1.2× | 1 |
| Thom Tillis | R–NC | $84.8M | $19.2M | 4.4× | 4 |
| John Fetterman | D–PA | $84.7M | $37.1M | 2.3× | 2 |
| David McCormick | R–PA | $83.1M | $36.6M | 2.3× | 2 |
| Joni Ernst | R–IA | $82.1M | $10.6M | 7.8× | 4 |
| Mark Kelly | D–AZ | $82.0M | $32.8M | 2.5× | 4 |
| Tim Sheehy | R–MT | $64.8M | $18.8M | 3.4× | 1 |
| Tammy Baldwin | D–WI | $61.0M | $13.1M | 4.7× | 4 |
| Susan Collins | R–ME | $54.9M | $9.0M | 6.1× | 4 |
| Elissa Slotkin | D–MI | $54.8M | $26.3M | 2.1× | 4 |
All twelve are senators — Senate races carry the outside money. Ranked by total opposition spending across the four completed cycles; the cycles column shows how many of the four the member appears in. Verified July 15, 2026.
Every one of the twelve is a senator. That is the second structure hiding in the data: House races barely register at this scale. The attack machine is a Senate instrument, pointed at whichever handful of seats decides control — Georgia, Pennsylvania, Ohio, Arizona, Wisconsin, Maine, Montana, Iowa, North Carolina, Michigan.
5. Two machines, pointed in different directions
Splitting the money by the donor's industry shows something the aggregate hides: there is not one campaign-finance system. There are two, and they behave nothing alike.
Industries give directly and almost never attack. Finance PACs contributed $79.2M straight to members' campaigns across this period and spent $0.0M on opposition advertising — not a rounding error, zero. Healthcare: $54.8M direct, $2.2M against. Labor unions: $93.8M direct, $29.2M against. This money buys a relationship with whoever wins.
Ideological and party committees barely give at all — they attack. Conservative ideological groups put $3.4M into direct contributions and $396.1M into opposition spending. Progressive groups: $5.3M direct, $245.6M against. The parties' own committees are the same shape: Republican committees $12.5M direct against $184.2M attacking, Democratic committees $2.5M direct against $192.1M attacking — each spending roughly 4.4× more to destroy than to promote.
An honest caveat on this section. Industry classification depends on a PAC-to-industry map that does not cover every committee: uncategorised committees account for roughly 56 percent of the dollars here ($814.3M direct, $683.1M for, $1,241.4M against). The categorised portion is a large sample, not a census, and the shape described above is drawn from that sample. The topline in sections 3 and 4 does not depend on the industry map at all.
6. Limitations and caveats
This is the money around sitting members, not all campaign money. The dataset keys to the 520 current members with a matched FEC candidate record. Spending on challengers who lost, on open seats, and on presidential races is outside it. The real national totals are much larger; these are the totals that attached to the people now in office.
Opposition spending is not a verdict on the member. A senator in a close race in a swing state draws attack money because the seat is contested, not because of anything they did. Warnock and Ossoff top the table because Georgia held three Senate races in the window, not because they are unusually disliked. The correct reading of a high number is “this seat mattered,” not “this person is bad.”
Ratios are noisy for members with little support spending. Ernst's 7.8× and Collins' 6.1× are driven partly by small denominators — incumbents who did not need much friendly advertising. The ratio is a real feature of the record, not a measure of unpopularity.
Direct PAC money is not all campaign money either. Individual contributions, the largest source of most campaigns' funding, are not in these three buckets. This paper compares PAC and independent-expenditure money, which is where the directional codes live.
Nothing here alleges wrongdoing by anyone. Independent expenditures are legal, constitutionally protected, and disclosed. Members do not control money spent against them and are not responsible for it. The finding is about the shape of the system, not the conduct of any person in it.
7. Conclusion
The story everyone tells about money in politics is a story about buying influence: donors give, politicians receive, something is expected in return. That story is real, and $1.3 billion of direct contributions says so.
It is also the smaller half. The bigger half is $2.38 billion spent by people who wanted somebody gone — money that never touched a campaign account, that the target could not refuse or return, and that both parties absorbed in amounts four tenths of one percent apart.
None of this was hidden. The FEC has required the direction code on every one of these filings for decades. The only thing required to see it was to stop adding the two numbers together.
Data availability
Primary sources. Federal Election Commission bulk records of PAC and party-committee disbursements, read with the FEC's own support/oppose direction codes and keyed to each member's FEC candidate identifier. Industry classification in section 5 uses a PAC committee-to-industry map; its coverage limit is stated in that section.
Derived dataset. The per-member, per-cycle three-way split is reproducible from the FEC bulk record and the matching rule described in section 2. A machine-readable export is available on request — see “Sourcing this for a story?” below.
Reproducibility & verification
This is an independent working paper. Produced by GovGreed Research; not externally peer-reviewed. The $2,383.4M / $1,119.2M / $1,303.9M three-way split, the 2.13× ratio, the per-cycle table, the 0.4 percent partisan gap ($1,195.8M vs $1,185.1M at 2.11× and 2.14×), the twelve-member ranking, and the industry figures in section 5 were derived live and verified as of July 15, 2026.
Sanity check. The totals land inside the range GovGreed's own documentation records as plausible for PAC and independent-expenditure money around congressional members — roughly $1–1.6 billion per cycle. The 2024 cycle reports $1,597.0M and 2020 reports $1,351.4M. A figure in the trillions would indicate the deprecated contributions table had been summed by mistake; it is not used in this paper.
Conflict of interest & funding
GovGreed is a commercial congressional-trading-intelligence platform; GovGreed Research is its analysis function. This paper received no external funding, and no member named here was given prior review. It uses only public federal records and is released free to read, quote, and reproduce under CC BY 4.0 with attribution. Nothing here alleges wrongdoing. Independent expenditures are lawful and constitutionally protected; members neither control nor report money spent against them, and a high opposition total reflects a contested seat rather than any conduct by the member. The paper is deliberately symmetrical because the data is: the partisan gap in attack money absorbed is 0.4 percent.
Revision history
v1.0 · 2026-07-15 — Initial publication. Directional split, per-cycle and per-party tables, twelve-member ranking and industry breakdown derived live and verified as of July 15, 2026.
Frequently asked
Sourcing this for a story?
Every figure on this page is reproducible from FEC bulk records, and the three-way split rule is stated in section 2. Machine-readable exports of the per-member, per-cycle directional totals are available to journalists on request. Methods across the series are documented at /research.
References & data sources
- Federal Election Commission bulk records — PAC and party-committee disbursements, per transaction, with support/oppose direction codes; keyed to FEC candidate identifiers. 520 sitting members, cycles 2018, 2020, 2022, 2024.
- Cycle completeness — the 2026 cycle is excluded as in-progress ($247.9M direct contributed; only $5.4M in opposition spending recorded as of July 15, 2026).
- Industry classification (section 5) — PAC committee-to-industry map; uncategorised committees account for ~56% of the dollars and the section says so.
- Image credit — 2022 Ohio election yard signs — Engrigg22, CC0 via Wikimedia Commons.
Keep pulling the thread
Every disclosure, every trade, every bill — cross-referenced.
Start Free — See Today's Top 10 SignalsNot financial advice. All data from public federal disclosures.