The Committee Advantage
Members of Congress are assigned to committees that write the rules for whole industries — and some of them trade, overwhelmingly, in exactly those industries. We scored every member on how much of their portfolio overlaps the sectors their committees oversee. For one senator it's 87%. Twenty-three are over half. The list is split down the middle between the parties.
Members of Congress sit on committees that regulate specific industries, and some trade heavily in exactly those industries. We quantify the overlap with a committee-alignment score: the share of a member's disclosed stock trades that fall in the economic sectors mapped to the committees they sit on. Among members with at least 25 trades, the leaderboard is steep and bipartisan: Sen. David McCormick (R-PA) at 87%, Sen. John Hickenlooper (D-CO) 81%, Sen. Jack Reed (D-RI) 78%, and Sen. Tina Smith (D-MN) 74%. Twenty-three members trade more than half their book in their committees' sectors — split exactly 11 Democrats to 11 Republicans (plus one independent) — and 49 are above 30%. Alignment is a structural conflict-of-interest measure: it shows where oversight and ownership coincide, which is visible in public records. It is not, by itself, evidence that any individual trade used non-public information.
- Key findings
- The most committee-aligned trader is Sen. David McCormick (R-PA) — 87% of his trading is in sectors his committees oversee.
- Of the 23 members above 50% alignment, the split is 11 Democrats, 11 Republicans (and one independent) — a dead heat.
- 49 members trade at least 30% of their book in their committees' sectors.
- Several sit on the committee that governs the sector they trade: McCormick (Banking), Reed (Armed Services), Wyden (Finance), French Hill (Financial Services).
- Alignment is a conflict map, not an accusation — overlap between what a member regulates and what they own, visible in public filings.
1. Introduction: oversight meets ownership
The committee is where congressional power actually lives. A seat on Banking shapes the rules for finance; a seat on Armed Services shapes defense procurement; a seat on Energy shapes oil, gas, and power. The committee member sees the hearings, the draft text, and the industry witnesses before the public does. The question this paper asks is narrow and checkable: how often does a member's stock portfolio sit in the very sector their committee governs?
We are not asking whether any single trade was timed to a hearing — that is a different, harder question. We are measuring the standing overlap between oversight and ownership, member by member, because that overlap is the precondition for every committee-timing concern and because, unlike intent, it is fully visible in public records.
2. Data and methodology
For each member we report a committee-alignment score: the share of their disclosed stock trades that fall in the economic sectors mapped to the committees they sit on. A senator on Banking who trades financials, or one on Armed Services who trades defense and industrials, scores high; one whose trades scatter across unrelated sectors scores low. We restrict the leaderboard to members with at least 25 trades so the ratio is stable, and report it as a percentage.
The exact recipe, because v1.0 did not state it and the number cannot be rebuilt without it. The score is not computed for this paper — it is the stored committee_alignment_pct column on each member's profile row, recomputed nightly. Its definition is:
numerator — the member's disclosed trades whose company sector matches a sector mapped to a committee
they actively sit on, counting only mappings with a committee→sector weight of 0.60 or higher;
denominator — all of that member's trades in a company with a known sector.
Trades are the raw disclosure rows, not deduplicated. The stored value is on a 0–1 scale; we
render it as a percentage. A profile exists at all only for members with 5+ trades; this leaderboard then filters to 25+.
That weight threshold is the whole ballgame, and it is why a naive rebuild disagrees. The committee→sector map holds 101 rows with weights from 0.40 to 0.95. The 0.60 cut-off keeps 66 of them and drops 35 — the loose, incidental jurisdiction links. Rebuild the score without that filter, exactly as v1.0's prose described it, and the count of members above 50 percent rises from 24 to 42. Nearly half the apparent “alignment” in the naive version comes from weak mappings. A reader who followed v1.0's method would have got 42 and been right to; the paper simply was not describing what it had done.
Dating. Because the score is a stored snapshot rather than a live computation, it carries the date of the last nightly recompute, not the date of publication. v1.0 said the figures were “re-derived live on June 30, 2026”; they were not re-derived at all. Table 1 is the stored snapshot, which still returns 23 members above 50 percent and McCormick at 87%. An independent live rebuild of the pinned recipe on July 15, 2026 returns 24 members and McCormick at 88% — three days of new disclosures. Jack Reed (78%) and Tina Smith (74%) are identical in both.
Three cautions. First, alignment is sector-level, not bill-level: it captures that a member trades the industries they oversee, not that any trade tracked a specific markup or vote. Second, it is a proxy built on a committee→sector mapping; a member with broad committee assignments has more sectors that can “count,” so very high scores partly reflect breadth of jurisdiction. Third, and most important, alignment is not wrongdoing — many members trade through managed or blind-style accounts, and owning the sector you regulate is currently legal. We measure overlap; we do not allege intent.
3. The leaderboard
Ranked by the share of trading inside their committees' sectors, the most-aligned members cross both parties and both chambers. The striking cases are the ones where the member sits on the committee that defines the sector they trade.
Table 1 · Most committee-aligned traders (members with ≥25 trades)| Member | Party | St. | Alignment | Trades mostly in… |
|---|---|---|---|---|
 DMDavid McCormick DMDavid McCormick | R | PA | 87% | finance, technology |
 JHJohn Hickenlooper JHJohn Hickenlooper | D | CO | 81% | telecom, comms, tech |
 KBKatie Boyd Britt KBKatie Boyd Britt | R | AL | 78% | technology, finance |
 JRJack Reed JRJack Reed | D | RI | 78% | healthcare, tech, infra |
 TSTina Smith TSTina Smith | D | MN | 74% | healthcare, tech, ag |
 KSKim Schrier KSKim Schrier | D | WA | 70% | technology, healthcare |
 DRDeborah K. Ross DRDeborah K. Ross | D | NC | 70% | technology, mining |
 AMAshley Moody AMAshley Moody | R | FL | 68% | technology, infra |
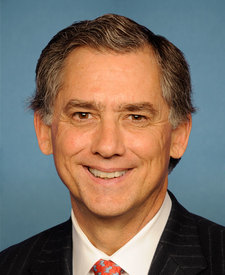 FHJ. French Hill FHJ. French Hill | R | AR | 59% | finance, financial svcs |
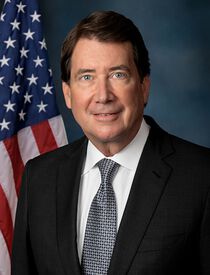 BHBill Hagerty BHBill Hagerty | R | TN | 59% | financial svcs, tech |
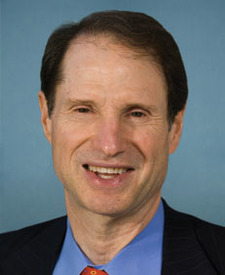 RWRon Wyden RWRon Wyden | D | OR | 56% | technology, finance |
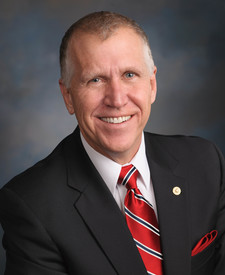 TTThom Tillis TTThom Tillis | R | NC | 60% | healthcare, industrials |
Committee-alignment = share of a member's disclosed trades in sectors mapped to their committees; members with ≥25 trades. Bipartisan throughout (R, D, and independents appear). “Trades mostly in” shows the member's top disclosed sectors. Verified June 30, 2026. Look up any member on the Congress leaderboard.
4. When the chair trades the sector
Alignment is most pointed when the member doesn't just sit on a relevant committee but helps lead it. Several of the names above do. Sen. David McCormick — a former hedge-fund chief executive — sits on Senate Banking, which writes the rules for the financial sector that makes up most of his 87%-aligned book. Sen. Ron Wyden is the senior Democrat on the Finance Committee, the panel with jurisdiction over taxes and much of the economy. Rep. French Hill leads on Financial Services; Sen. Jack Reed is the senior Democrat on Armed Services. In each case the committee defines the rules for the industry that dominates the member's trading.
5. Discussion
The committee-alignment lens reframes the reform argument productively. Opponents of a trading ban often note — correctly — that proving a specific trade exploited a specific hearing is nearly impossible. The alignment data make that objection beside the point. You do not need to prove intent to see the problem the reforms target: a measurable share of Congress holds, and actively trades, the industries their committees govern, and the system permits it. The recurring proposals — banning individual-stock ownership by members, or requiring genuine blind trusts — are simply ways to drive this number toward zero. The data here are the baseline those proposals would move.
It also explains why the issue is bipartisan and durable. The 23 members above 50% split 11–11; the incentive to own what you oversee is structural, not partisan. As long as committee seats convey both influence over an industry and an information vantage on it, some members will hold that industry — and the public record will keep showing it.
6. Limitations and caveats
- Sector-level, not bill-level. Alignment shows a member trades the industries they oversee, not that any trade tracked a specific markup, hearing, or vote.
- It's a proxy. The score rests on a committee→sector mapping and on companies' sector labels; members with broad jurisdiction have more sectors that “count,” so very high scores partly reflect breadth.
- Alignment ≠ wrongdoing. Owning the sector you regulate is currently legal, and many members trade through managed or blind-style accounts. We measure overlap, not intent.
- Minimum sample. The leaderboard is restricted to members with ≥25 trades; members who rarely trade are excluded, not cleared.
- Committee roles (chair / senior member) are described from the public record for context; the alignment score itself reflects committee membership, not leadership rank.
7. Conclusion
For a meaningful slice of Congress, the portfolio and the jurisdiction are the same map. One senator trades 87% inside the sectors his committees govern; 23 members are over half; and the line between the parties runs straight down the middle. No single trade has to be sinister for that to matter: the people writing an industry's rules are, measurably and legally, invested in it. The committee advantage is not a secret a leak revealed. It is a structure the disclosures describe — and the reason the trading-ban debate refuses to die.
Data availability
Primary sources. Trades come from congressional Periodic Transaction Reports (STOCK Act); committee membership and the committee→sector mapping drive the alignment score, computed in GovGreed's politician_profiles. Company sectors come from the companies reference table.
Derived dataset. The alignment leaderboard and the party-split counts are reproducible from the member profiles and trade history on the platform. A machine-readable export of every member's committee-alignment score is available on request — see “Sourcing this for a story?” below.
Reproducibility & verification
This is an independent working paper. Produced by GovGreed Research; not externally peer-reviewed. v1.1 corrects how this section describes its own method. The leaderboard, the 23-member ≥50% count and its 11–11 party split, and the 49-member ≥30% count are read from the stored committee_alignment_pct column on each member's profile row — they were not re-derived live, and the trades behind them are raw, not deduplicated (v1.0 claimed both the opposite).
The pinned recipe, so this is rebuildable. Numerator: the member's trades whose company sector matches a sector mapped to a committee they actively sit on, counting only committee→sector mappings with weight ≥ 0.60. Denominator: all their trades in a company with a known sector. Raw disclosure rows. Stored on a 0–1 scale, rendered here as a percentage. Profiles exist for members with 5+ trades; this leaderboard filters to 25+. The nightly recompute is calculate_politician_profiles().
Verification of the fix. An independent live rebuild of that recipe on July 15, 2026 returns 24 members above 50% and McCormick 88%, against the stored snapshot's 23 and 87% — a three-day gap of new disclosures. Jack Reed (78%) and Tina Smith (74%) reproduce to the point. Drop the 0.60 weight filter, which is what v1.0's prose actually described, and the count goes to 42: the map holds 101 rows, the threshold keeps 66 and drops 35, and those 35 weak links carry nearly half the apparent alignment.
Conflict of interest & funding
GovGreed is a commercial congressional-trading-intelligence platform; GovGreed Research is its analysis function. This paper received no external funding, and no person named in it was given prior review. It uses only public federal records and is released free to read, quote, and reproduce under CC BY 4.0 with attribution. Committee alignment is a structural overlap measure; nothing here alleges wrongdoing by any individual.
Revision history
v1.1 · 2026-07-16 — Method pinned. No figure in Table 1 changed. v1.0 was not reproducible, and an internal audit flagged it: rebuilding it from its own prose returned 42 members above 50%, not 23. The cause was a filter the paper never mentioned. The score is the stored committee_alignment_pct column, and its definition counts a trade as aligned only when the company's sector maps to an active committee assignment with a committee→sector weight of 0.60 or higher — a threshold that keeps 66 of 101 mappings and discards 35. Without it the count is 42; with it, 24 on a live rebuild and 23 in the stored snapshot the paper published. v1.0 also mis-described itself twice more: the figures were not “re-derived live on June 30, 2026” (they are a stored snapshot from the nightly recompute), and the trades are raw, not “deduplicated.” Section 2 now states the numerator, the denominator, the weight threshold, the scale, both trade filters and the function that produces it; the Reproducibility section carries the live-rebuild check. Nothing here changes the paper's conclusion — McCormick 87%, Reed 78%, Smith 74% and the 11–11 party split all stand. What changes is that a reader can now get the same number, which for a paper with a “Reproducibility” heading was the whole obligation.
v1.0 · 2026-06-30 — Initial publication.
Frequently asked
Sourcing this for a story?
Free to use in a thread, article, or video — just credit GovGreed with a link to this page. Want every member's committee-alignment score, a single member's sector-by-committee breakdown, or the full ≥30% list? Email govgreed@gmail.com — usually 24–48h, free with a link credit.
References & data sources
- STOCK Act disclosures — congressional Periodic Transaction Reports, in GovGreed's Congress database; per-member history on any member page.
- Committee alignment — computed in
politician_profilesfrom committee membership and a committee→sector mapping. - Methodology — GovGreed Research: sources & methods.
- Companion papers — The Greediness Index (GGR-WP-2026-08) · The Deregulation Supercut (GGR-WP-2026-06).
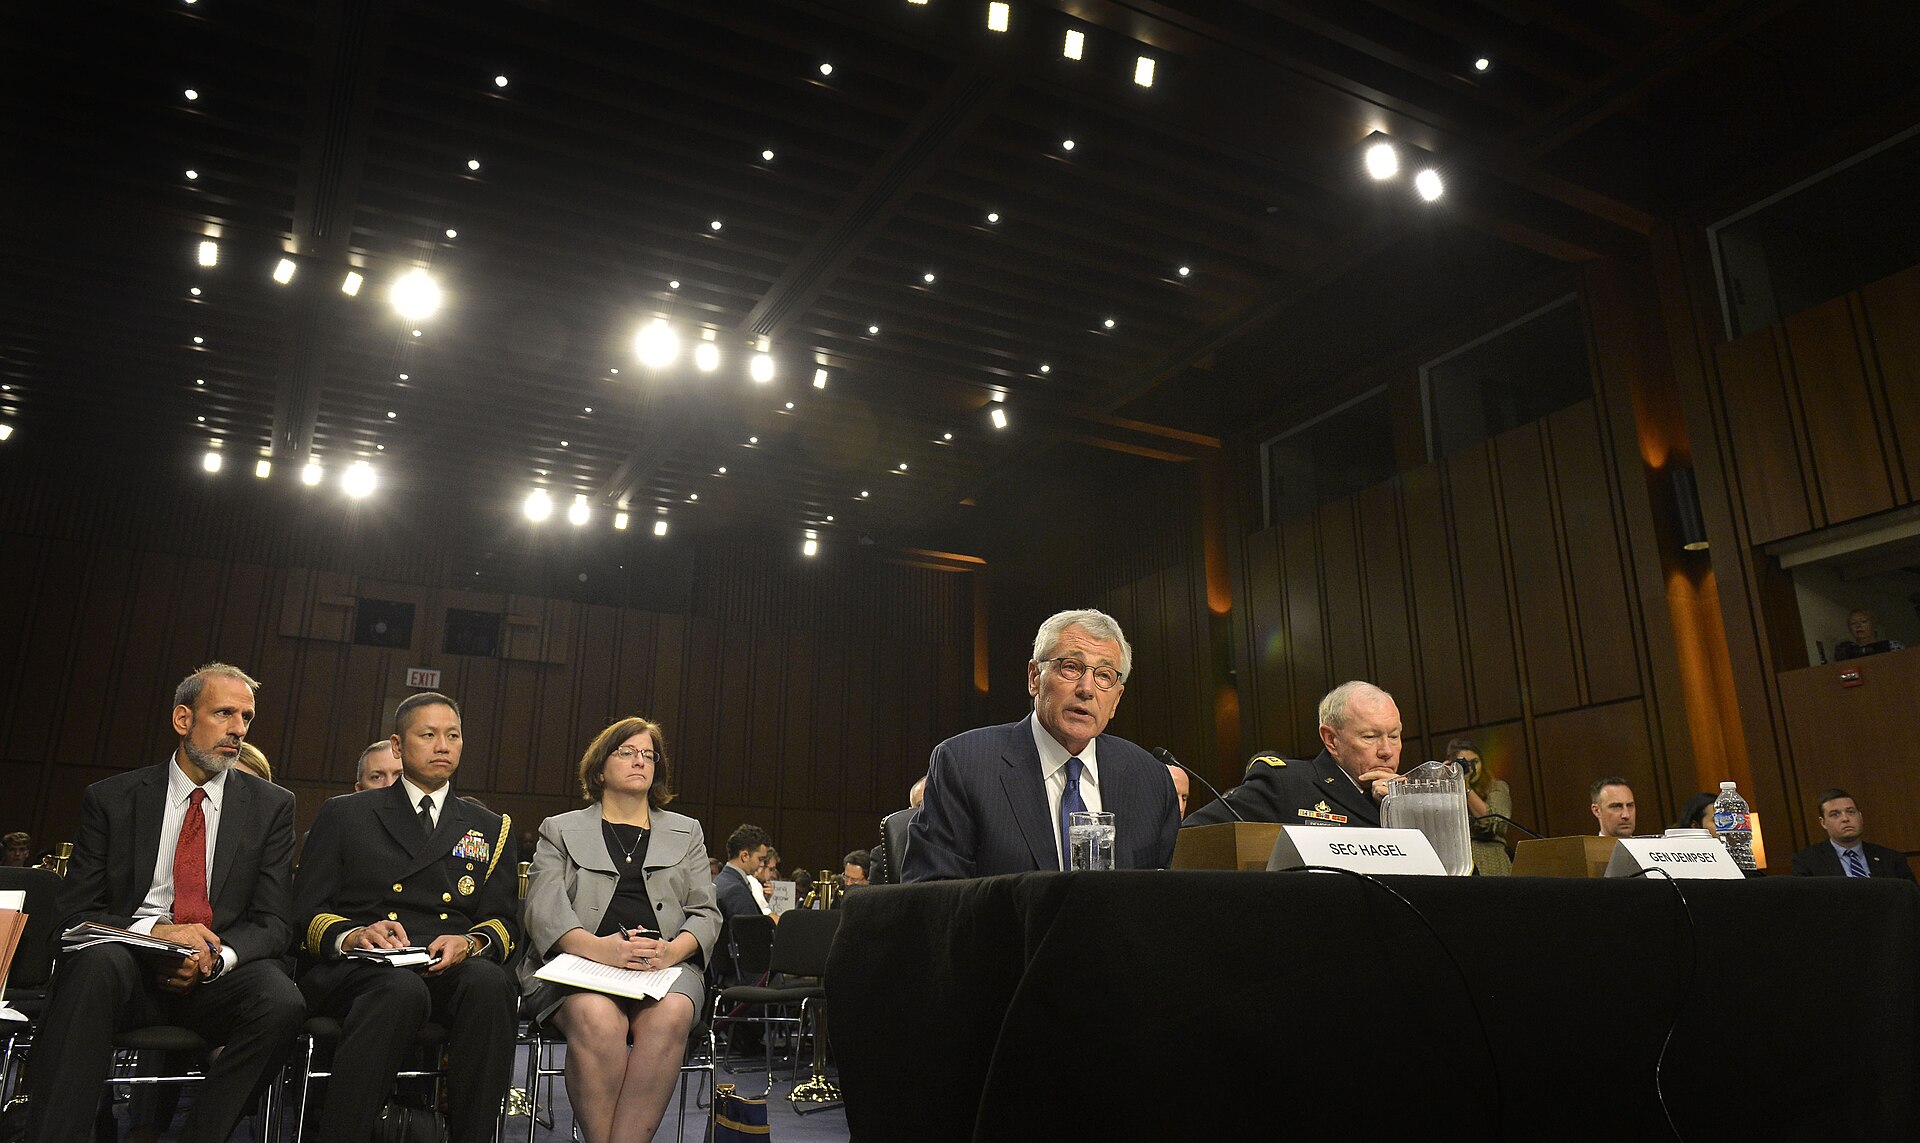
- Image credit (public domain): Senate Armed Services Committee hearing — DoD photo by Glenn Fawcett, via Wikimedia Commons.
Keep pulling the thread
See the receipts — free
Every member, scored against the committees they sit on and the sectors they trade. Free account: today’s top 10 signals + predictions. No card required.
Not financial advice. All data from public federal disclosures.