The Greediness Index
We scored every member of Congress on how hard they trade — frequency, volume, recency — and the top of the list is bipartisan. Then we did the thing the score begs for: we lined it up against a $174,000 salary, and against the members' own net-worth disclosures. The trading dwarfs the salary. For some, so does the decade.
We define a Greediness Index — a 0–100 composite of trading frequency, dollar volume, and recency — and rank every member of Congress on it from deduplicated STOCK Act disclosures. The leaderboard is bipartisan and tightly packed at the top: Nancy Pelosi (98.7), Ro Khanna (98.6), Josh Gottheimer (98.6) and Michael McCaul (97.5). McCaul's disclosed trading volume of ~$869 million is roughly 5,000× a rank-and-file member's $174,000 salary. We then pair the Index with members' annual Personal Financial Disclosures: across the 2018–2025 filings we can parse, disclosed asset value rose by tens of millions for several of the most active traders — Pelosi ~+$89M, Markwayne Mullin ~+$63M (≈8.6×), Josh Gottheimer ~+$30M (≈4.5×) — against cumulative congressional pay near $1.2M over the same years. We are explicit throughout: the Index measures intensity, not wrongdoing, and net-worth growth is not trading profit — it largely reflects market appreciation, spousal and private-business assets, and bracketed estimates.
- Key findings
- The Greediness leaderboard is bipartisan: Pelosi (D) 98.7, Khanna (D) 98.6, Gottheimer (D) 98.6, McCaul (R) 97.5.
- Volume leader is McCaul (R-TX) at ~$869M; Khanna (D-CA) has the most trades, 24,822 — and ~$580M.
- A rank-and-file member earns $174,000/yr. McCaul's volume is ~5,000× that; Khanna's ~3,300×.
- Disclosed net worth 2018→2025 rose ~$89M for Pelosi, ~$63M (≈8.6×) for Mullin (R), ~$30M (≈4.5×) for Gottheimer (D).
- Caveat: “greediness” is intensity, not crime; net-worth growth is mostly market gains and outside assets, not trading profit.
1. Introduction: a score for intensity
“Congress trades a lot” is true but useless. To compare members you need a single, transparent number, and a single number forces a choice about what “a lot” means. We chose three ingredients that any reasonable observer would accept: how often a member buys (frequency), how much they move in dollars (volume), and how recently they were active (recency). Blend them on a 0–100 scale and you get the Greediness Index — a leaderboard of trading intensity that is reproducible, party-blind, and updatable every month.
One disclaimer belongs at the top, not the bottom. “Greediness” here is a measure of activity, not a verdict. A high score means a member trades frequently, in size, and recently — nothing about whether any trade was improper. We keep that line through the whole paper, including the part everyone actually wants, in §5: what happened to these members' net worth while they traded.
2. The formula
The Index is intentionally simple, so anyone can rebuild it. Each component is capped so a single dimension can't run away with the score, and recency decays linearly over two years:
# Snapshot = trades with filed_date <= asOf (what was on the record that day).
daysSince = asOf − lastTradeDate
freqScore = min(buyCount / 50, 1) × 40 # up to 40 pts for trading often
volScore = min(totalVol$M / 100, 1) × 30 # up to 30 pts for dollar size
recencyScore = max(0, 1 − daysSince / 730) × 30 # up to 30 pts for trading recently
greediness = freqScore + volScore + recencyScore # 0–100
Volume uses the midpoint of each trade's disclosed bracket, summed over a member's deduplicated trades; frequency counts purchases. The caps mean the very top of the table compresses — once you trade often enough and big enough, you max those components and the recency term separates you — which is why the leaders sit within two points of each other.
Two dates, or the numbers below do not reproduce. This score is a standing, not a property, and rebuilding it takes both lines at the top of the formula.
1 · The score decays. daysSince counts from asOf, so a member's score
falls slightly every day they do not trade. At the top of the table the other two components are maxed out, which means
recency alone decides the order. Re-run this on a later date and the leaders reshuffle — someone who keeps
filing overtakes someone who has gone quiet, without either doing anything new. Table 1 is a standing on
June 30, 2026. Anyone re-running it today should expect a different first place. That is the index
working, not drifting.
2 · The past keeps changing, and that is this paper's own subject biting it. Members have up to 45
days to file, and the average gap is around seven weeks — so “the data as of June 30” is not
“trades dated before June 30.” Filings that landed in July disclosed trades made in May, quietly adding buys and
moving lastTradeDate backwards into a window we had already scored. Rebuild Table 1 with
trade_date <= asOf and you get scores we never published; rebuild it with
filed_date <= asOf — the record as it actually stood that morning — and all fifteen rows
return to the decimal. The disclosure lag this paper measures is the same lag that makes the paper hard to reproduce. We
state both conditions so it is reproducible anyway.
3. The leaderboard
Here is the top of Congress by Greediness. Read the party column first: the four highest scores are two Democrats, then a Democrat, then a Republican, and the top fifteen alternate throughout. This is not a one-party story.
Table 1 · The Greediness Index — top 15 (deduplicated trades)| # | Member | Party | St. | Buys | Volume | Score |
|---|---|---|---|---|---|---|
| 1 | 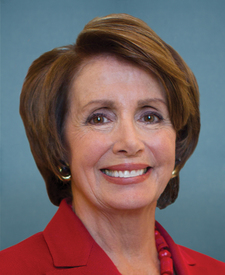 NPNancy Pelosi NPNancy Pelosi | D | CA | 103 | $233M | 98.7 |
| 2 | 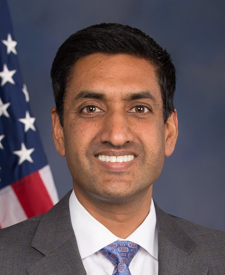 RKRo Khanna RKRo Khanna | D | CA | 14,034 | $580M | 98.6 |
| 3 | 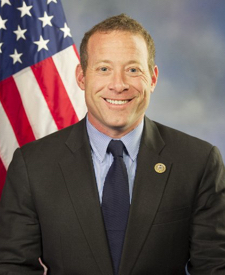 JGJosh Gottheimer JGJosh Gottheimer | D | NJ | 1,435 | $224M | 98.6 |
| 4 |  MMMichael McCaul MMMichael McCaul | R | TX | 7,818 | $869M | 97.5 |
| 5 |  JSJefferson Shreve JSJefferson Shreve | R | IN | 195 | $99M | 92.3 |
| 6 |  SDSuzan DelBene SDSuzan DelBene | D | WA | 123 | $170M | 90.0 |
| 7 |  SFScott Franklin SFScott Franklin | R | FL | 110 | $79M | 88.1 |
| 8 |  KHKevin Hern KHKevin Hern | R | OK | 543 | $44M | 81.1 |
| 9 |  TTTommy Tuberville TTTommy Tuberville | R | AL | 438 | $52M | 77.6 |
| 10 |  SCSusan M. Collins SCSusan M. Collins | R | ME | 130 | $45M | 77.3 |
| 11 |  GCGilbert Cisneros GCGilbert Cisneros | D | CA | 1,453 | $28M | 77.3 |
| 12 |  VFVirginia Foxx VFVirginia Foxx | R | NC | 752 | $25M | 75.6 |
| 13 |  DMDavid McCormick DMDavid McCormick | R | PA | 49 | $25M | 75.5 |
| 14 |  TSThomas Suozzi TSThomas Suozzi | D | NY | 321 | $19M | 73.6 |
| 15 |  SWSheldon Whitehouse SWSheldon Whitehouse | D | RI | 348 | $16M | 67 |
Greediness = capped(frequency) + capped(volume) + recency, on deduplicated STOCK Act trades. Volume is summed bracket midpoints (gross turnover, not profit). Bipartisan throughout. Verified June 30, 2026. Look up any member on the Congress leaderboard.
3.1 How bipartisan is the greed?
The leaderboard's top is bipartisan, but so is the whole distribution. Of the 221 members who trade individual stocks at all, 65 score 50 or higher on the Index — and that group splits almost evenly: 30 Democrats, 34 Republicans. At the very top, 23 members score 70+, again from both parties. Whatever congressional stock-trading is, it is not a habit of one side: the propensity to trade often, large, and recently is distributed across the aisle to within four seats.
Figure 1 · The Greediness distribution (members who trade individual stocks)Greediness computed for all 221 members with individual-stock trades. The 65 scoring 50+ split 30 D / 34 R — bipartisan to within four seats. Verified June 30, 2026.
4. The salary anchor
A number is only as meaningful as what you compare it to. The natural yardstick is the job itself: a rank-and-file member of Congress is paid $174,000 a year (leadership earns modestly more — the Speaker $223,500). Set the trading volume beside that salary and the scale becomes legible.
Figure 2 · Disclosed trading volume vs. a year's salary ($174K)Volume is gross turnover, not profit — a member who buys and sells the same $1M position ten times shows $10M of volume and may have made nothing. We are not claiming these members earned multiples of their salary. The point is narrower and stranger: the financial activity flowing through these offices is measured in hundreds of millions of dollars, while the office pays $174,000. The day job is a rounding error next to the portfolio.
5. Before and after: the net-worth trajectory
Trading intensity is a flow. Net worth is the stock it feeds — and Congress discloses that too, once a year, on the Personal Financial Disclosure (the annual Form 278, distinct from the trade reports). Each asset is reported in a value bracket; summing the midpoints gives an estimated total. We computed it for the most active traders at their earliest parseable filing (2018–2019) and their latest (2024–2025), and set the change against the salary they collected over the same span.
Table 2 · Disclosed net worth, earliest vs. latest filing (estimated, asset midpoints)| Member | P. | Then | Now | Change | Salary (same yrs) |
|---|---|---|---|---|---|
| NPPelosi | D | $140M ’18 | $229M ’25 | +$89M | $1.2M |
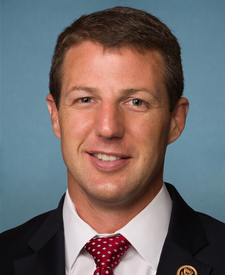 MMMullin MMMullin | R | $8.4M ’18 | $71.7M ’25 | +$63M (8.6×) | $1.2M |
| KHHern | R | $45M ’19 | $104M ’24 | +$58M | $0.9M |
| SDDelBene | D | $72M ’18 | $113M ’25 | +$41M | $1.2M |
| JGGottheimer | D | $8.5M ’18 | $38M ’24 | +$30M (4.5×) | $1.0M |
| SWWhitehouse | D | $7.2M ’18 | $21.6M ’25 | +$14M (3×) | $1.2M |
| TSSuozzi | D | $2.0M ’18 | $9.6M ’24 | +$7.6M (4.9×) | $1.0M |
Estimated net worth = sum of disclosed asset-value bracket midpoints, one filing per member per year. “Then” = earliest parseable filing (2018–19), “Now” = latest (2024–25). Salary = years in span × $174K. Bipartisan. Not trading profit — see §6. Verified June 30, 2026.
6. What this does and does not show
This is the section that keeps the paper honest, so read it before quoting the last one. Net-worth growth is not trading profit, and we are not implying it is. Three forces drive most of it: (1) markets rose — the S&P 500 roughly doubled over 2018–2025, so any large equity portfolio grew substantially without a single clever trade; (2) outside wealth — spousal businesses (Pelosi), private companies (Mullin's plumbing firm, Hern's franchises), real estate, and inheritances sit in these totals and have nothing to do with congressional trading; and (3) bracket noise — disclosures report ranges, so a midpoint sum is an estimate with wide error bars.
So what does the table show? Two real things. First, scale: the people writing financial, tax, and antitrust law hold eight- and nine-figure portfolios, which is a structural fact about who serves and what conflicts they carry, independent of any trade. Second, trajectory: for the most active traders, wealth moved up and to the right far faster than the salary that nominally funds their public life. Neither is an accusation. Both are context the public rarely sees lined up in one place.
7. Discussion: why a recurring index
The Greediness Index is designed to be run again. Because it is a transparent formula over public data, it can be refreshed monthly — the leaderboard shifts as members trade, go quiet, or leave office, and the net-worth panel updates each summer when new annual disclosures post. Tracked over time it answers a question the headlines can't: not “did this one trade look bad,” but “which offices are consistently the most active, and is the wealth behind them growing faster than any salary can explain?” That is a slower, sturdier story than any single suspicious-looking trade, and it is the one the data actually support.
8. Limitations and caveats
- “Greediness” = intensity, not wrongdoing. A high score means frequent, large, recent trading. It is not a finding of insider trading or any impropriety.
- Volume is gross turnover. It double-counts round-trips and is not profit. We never present volume as earnings.
- Net worth is estimated, gross, and bracketed. It sums asset-value midpoints and does not net out liabilities (disclosed separately and sparsely). Treat the totals as order-of-magnitude, not precise.
- Net-worth growth is mostly not trading. Market appreciation, spousal and private-business assets, real estate, and inheritances dominate; attributing the change to congressional trading would be wrong.
- Coverage gaps. A few high-volume members (e.g. Khanna, McCaul) have annual filings whose asset detail is not yet machine-parsed, so they appear on the trading leaderboard but not the net-worth table. They are omitted, not excluded for cause.
- Deduplicated trades. All trade counts and volume use the deduplicated disclosure set to neutralize the raw feed's double-ingestion.
9. Conclusion
The Greediness Index puts a number on something everyone senses: a slice of Congress trades like a hedge fund. The leaderboard is bipartisan, the volumes run to hundreds of millions, and the salary that defines the job — $174,000 — is a rounding error against them. Line the index up against the members' own net-worth disclosures and the trajectory is steep, even after you strip out the market and the spouse's business. None of it, on its own, is a crime. All of it, taken together, is the reason the question won't go away.
Data availability
Primary sources. Trade frequency, volume, and recency derive from congressional Periodic Transaction Reports filed under the STOCK Act, tracked in GovGreed's Congress database. Net worth derives from members' annual Personal Financial Disclosures (Form 278), parsed into the platform's pfd_filings / pfd_assets tables. The $174,000 salary and $223,500 Speaker figure are matters of public record.
Derived dataset. The full Greediness leaderboard and the net-worth panel are reproducible: trade history sits on each member page, and the formula in §2 is complete. A machine-readable export of the index and the wealth-trajectory table is available on request — see “Sourcing this for a story?” below.
Reproducibility & verification
Rebuild conditions (v1.1). Table 1 reproduces to the decimal under exactly two conditions, both stated in the formula block in section 2: the recency anchor is asOf = 2026-06-30, and the trade set is the record as it stood that day — filed_date <= 2026-06-30, not trade_date <= 2026-06-30. The distinction is not pedantry: members have up to 45 days to file, so filings that arrived in July disclosed trades made in May and retroactively changed what June looked like. Scoping by trade date instead of filing date returns numbers this paper never published. Confirmed by re-derivation on 2026-07-15.
This is an independent working paper. Produced by GovGreed Research; not externally peer-reviewed. Every figure — the leaderboard scores, the volume totals, the salary multiples, and the net-worth then/now values — was re-derived live from the production database on the publication date, with all trade counts taken from the deduplicated set and all net-worth values computed as asset-bracket midpoint sums (liabilities not netted; the limitation is disclosed in §6 and §8).
Conflict of interest & funding
GovGreed is a commercial congressional-trading-intelligence platform; GovGreed Research is its analysis function. This paper received no external funding, and no person named in it was given prior review. It uses only public federal records and is released free to read, quote, and reproduce under CC BY 4.0 with attribution. The Greediness Index measures trading intensity, not wrongdoing; nothing here is a legal accusation against any individual.
Revision history
v1.1 · 2026-07-15 — Reproducibility fix. No published figure changed. Section 2 promised that “anyone can rebuild” the Index, and as written nobody could: the formula's daysSince term had no anchor date, and a reader would naturally scope the trade set with trade_date <= asOf. Neither reproduces Table 1. Both conditions are now stated in the formula block: asOf = 2026-06-30, and the snapshot is filed_date <= asOf — the record as it stood that morning, not every trade later revealed to have happened before it. Re-derived under those two conditions on 2026-07-15, all fifteen rows return to the decimal (Pelosi 98.7, Khanna 98.6, Gottheimer 98.6, McCaul 97.5, Shreve 92.3, DelBene 90.0, Franklin 88.1, Hern 81.1) with buy counts intact (Khanna 14,034; McCaul 7,818; Gottheimer 1,435; Pelosi 103). Also added: an explicit statement that the ranking is a standing that decays, so re-running it later legitimately reorders the leaders — on 2026-07-15 the live top score is Khanna at 99.4 and Pelosi has fallen to fourth on recency alone, having traded nothing since May 29. Table 1 remains the June 30 standing and is stamped as such.
v1.0 · 2026-06-30 — Initial publication. Leaderboard and net-worth panel derived live from the deduplicated STOCK Act set and parsed PFD filings.
Frequently asked
Sourcing this for a story?
Free to use in a thread, article, or video — just credit GovGreed with a link to this page. Want the full Greediness leaderboard, a single member's score breakdown, or the multi-year net-worth series? Email govgreed@gmail.com — usually 24–48h, free with a link credit.
References & data sources
- STOCK Act disclosures — congressional Periodic Transaction Reports, in GovGreed's Congress database; per-member history on any member page.
- Personal Financial Disclosures — annual Form 278 filings (House & Senate), parsed into
pfd_filings/pfd_assets. - Greediness formula — documented in full in §2 of this paper; consistent with the platform-wide definition.
- Methodology — GovGreed Research: sources & methods.
- Companion papers — The $200 Fine (who files late) · When Congress Moves as a Herd.
- Illustration: GovGreed.
Keep pulling the thread
See the receipts — free
Every member, scored on how hard they trade and against the bills and donors behind it. A free account opens today’s strongest signals and predictions — no card required.
It’s a live portal, not a page: GovGreed scores thousands of congressional signals and refreshes daily, and the AI assistant pulls the exact trades, bills, and filings behind any claim — just ask.
Not financial advice. All data from public federal disclosures.